
PATIENCE. AUTHENTICITY. EXPERIENCE
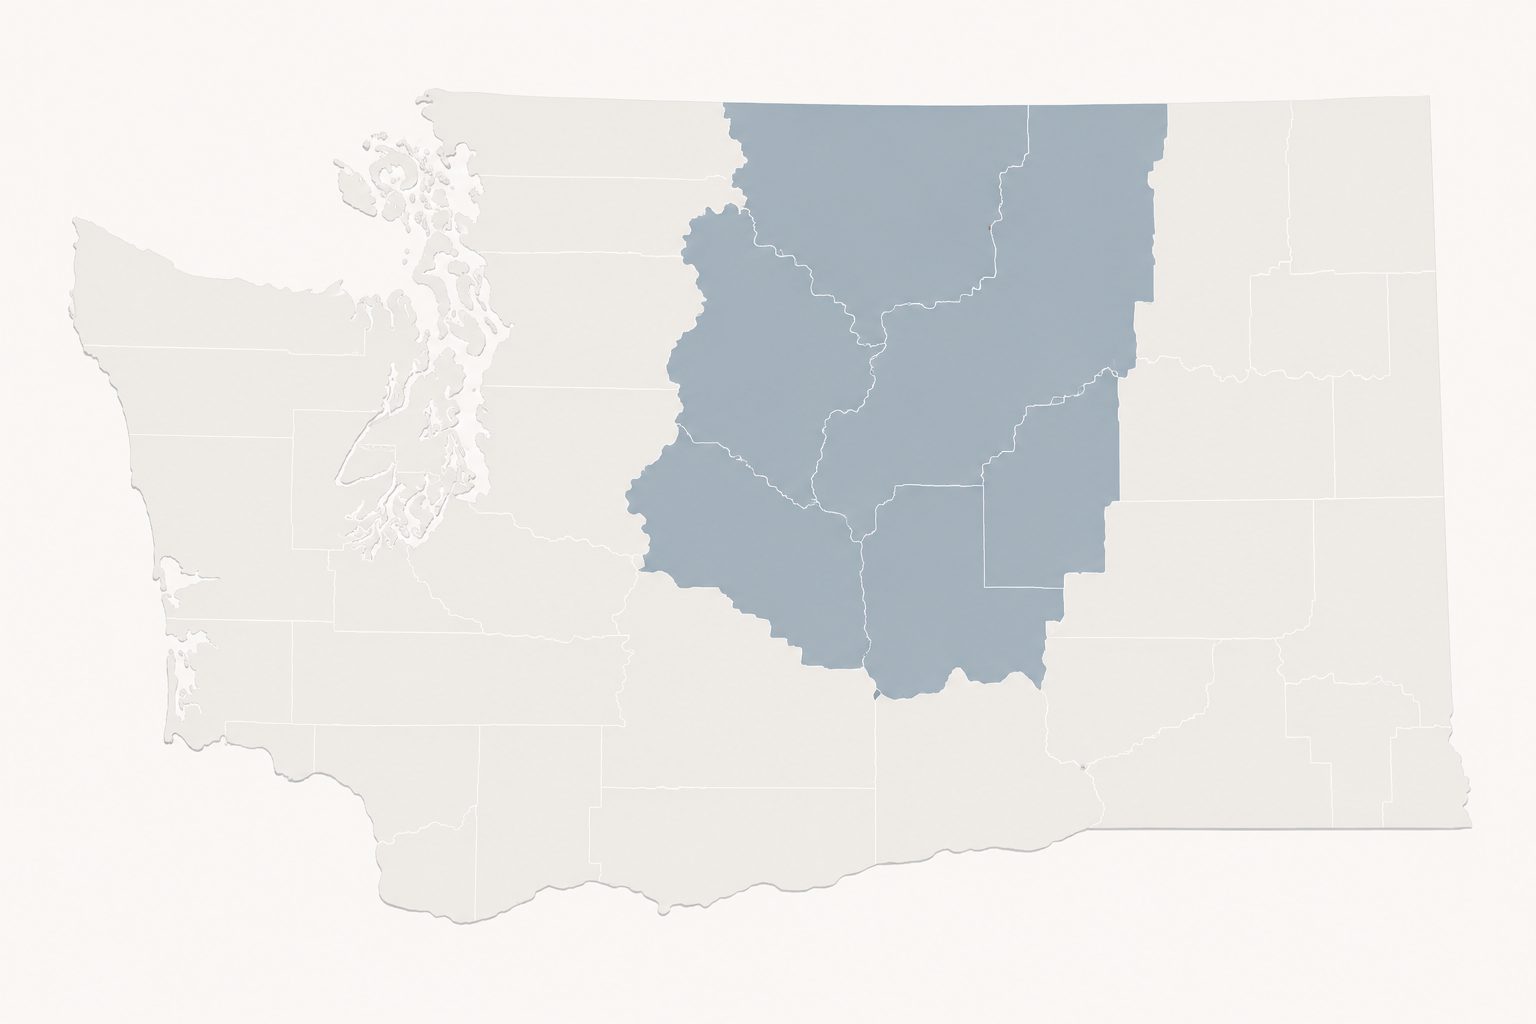
NORTH CENTRAL WASHINGTON MARKET SNAPSHOT
| Active Listings | 1,365 | 1,117 | 1,643 | +47.1% | +20.4 |
| Closed Sales | 808 | 528 | 771 | +46.0% | -4.6% |
| Median Sale Price | $450,000 | $433,333 | $467,423 | +7.9% | +3.9% |
| Median Days on Market | 20.3 | 48 | 25 | -47.9% | +23.2% |
| Months of Inventory | 4.5 | 5.6 | 5.8 | +3.6% | +28.9% |
| Sale-to-List Price Ratio | 98.7% | 98.0% | 98.6% | +0.6% | -0.1% |
| Sales Volume | $434,928,648 | $268,966,988 | $426,320,206 | +58.5% | -2.0% |
Data Source
Statistics in this report were compiled from Northwest Multiple Listing Service (NWMLS) Matrix. Unless otherwise noted, market statistics include residential single-family homes and condominiums. North Central Washington regional statistics include Chelan, Douglas, Grant, and Okanogan counties. Data reflects market activity from April 1st through June 30, 2026.
Featured Market Reports
A look at a few of North Central Washington's most active housing markets.
MARKET OVERVIEW (Q2 2026 VS Q1 2026)
ACTIVE LISTINGS (QUARTER END)
221 +56.7% FROM 141
CLOSED SALES (QUARTER TOTAL)
60 +130.8% FROM 26
MEDIAN SALE PRICE
$653,910 +4.7% FROM $624,408
SALE-TO-LIST PRICE RATIO
97.7% +1.4 pts FROM 96.3%
DAYS ON THE MARKET (MEDIAN)
24.7 -43.0% FROM 67.7
SALES VOLUME (QUARTER TOTAL)
$52.6M +87.3% FROM $28.1M
*All changes compare Q2 2026 to Q1 2026.
WHAT DOES THIS MEAN
For Buyers
✓ More choice, less pressure.
More inventory gives you more opportunities to compare homes before making a decision.
✓ The best homes still move quickly.
Well-priced waterfront and lake-view homes can still attract strong interest.
✓ Preparation creates an advantage.
Having financing ready puts you in a better position when the right property becomes available.
For Sellers
✓ Pricing matters more than ever.
Buyers have more options, making accurate pricing increasingly important.
✓ Presentation helps you stand out.
Professional photography, staging, and preparation can make a meaningful difference.
✓ Launch strong.
The first few weeks on the market often generate the most buyer interest.
For Investors
✓ Run the numbers carefully.
Evaluate insurance, taxes, maintenance, and management costs alongside potential rental income.
✓ Know the local rules.
Short-term rental regulations and operating requirements can influence long-term returns.
✓ Focus on the property, not the headline.
Two homes with similar prices can perform very differently depending on location, amenities, and buyer demand.
MARKET OVERVIEW (Q2 2026 VS Q1 2026)
ACTIVE LISTINGS (QUARTER END)
274 +39.8% FROM 196
CLOSED SALES (QUARTER TOTAL)
259 +42.3% FROM 182
MEDIAN SALE PRICE
$524,967 +0.4% FROM $522,843
SALE-TO-LIST PRICE RATIO
99.4% +.05 pts FROM 98.9%
DAYS ON THE MARKET (MEDIAN)
13.7 -45.3% FROM 59
SALES VOLUME (QUARTER TOTAL)
$158.3M +43.1% FROM $110.7M
*All changes compare Q2 2026 to Q1 2026.
WHAT DOES THIS MEAN
For Buyers
✓ More homes became available.
Inventory increased, giving buyers more opportunities to compare properties.
✓ Competition remains healthy.
Well-priced homes continue to attract strong interest.
✓ The market remains steady.
Stable pricing creates greater confidence when planning a purchase.
For Sellers
✓ Demand remains healthy.
Buyers continued purchasing homes even as inventory increased.
✓ Pricing still matters.
Well-priced homes continue selling close to asking price.
✓ Preparation creates an advantage.
Presentation and professional marketing help listings stand out.
For Investors
✓ Fundamentals remain stable.
A diverse local economy continues to support housing demand.
✓ Rental demand varies by neighborhood.
Location plays a significant role in long-term performance.
✓ Think beyond appreciation.
Cash flow, maintenance, and operating costs should all factor into an investment decision.
MARKET OVERVIEW (Q2 2026 VS Q1 2026)
ACTIVE LISTINGS (QUARTER END)
157 +98.7% FROM 79
CLOSED SALES (QUARTER TOTAL)
47 +23.7% FROM 38
MEDIAN SALE PRICE
$788,302 +17.3% FROM $672,000
SALE-TO-LIST PRICE RATIO
96.5% +4.6 pts FROM 91.9%
DAYS ON THE MARKET (MEDIAN)
23.4 -77.6% FROM 104.5
SALES VOLUME (QUARTER TOTAL)
$38.2M +150.0% FROM $15.3M
*All changes compare Q2 2026 to Q1 2026.
WHAT DOES THIS MEAN
For Buyers
✓ More inventory created more choice.
Buyers had significantly more homes to compare than they did during the winter.
✓ Demand returned with spring.
Well-priced properties continued attracting buyers despite higher inventory.
✓ Think beyond today's market.
Lifestyle, location, and long-term enjoyment often matter as much as short-term market conditions.
For Sellers
✓ Buyer activity improved.
More homes sold during Q2 as seasonal demand returned.
✓ Presentation matters.
With more listings available, homes that show well stand out more quickly.
✓ Pricing remains important.
Buyers are willing to pay for value, but they're comparing more options before making decisions.
For Investors
✓ Know the local regulations.
Short-term rental rules, operating costs, and management should be part of every investment analysis.
✓ Location influences performance.
Two homes with similar prices can have very different rental potential depending on where they're located.
✓ Tourism supports demand—but isn't the whole story.
Many buyers purchase in Leavenworth for personal use, retirement, or long-term ownership rather than purely for rental income.
North Central Washington Real Estate Frequently Asked Questions


Contact
Arturo Zavala
509.630.6365
arturozavala@windermere.com
Address
Windermere RE/ Lake Chelan
115 East Woodin Ave,
Chelan, WA 98816


© 2025 Windermere Real Estate
